Windows performance monitor is a real time performance monitoring tool. It gives result in three different ways, Graphical view Histogram view and plaint text counter view.
Some times we need to log the utilization of a server for the future reference. It includes various services like IIS, SQL, CPU, Disk usage etc.. you can write them to a file and you can analyse the file using this application itself. Here is the steps to configure windows performance monitor to log the data to a file. here you select the counters which you want.
Open the application,
Go to “RUN” and type “perfmon” ( It will open Performance monitoring window )
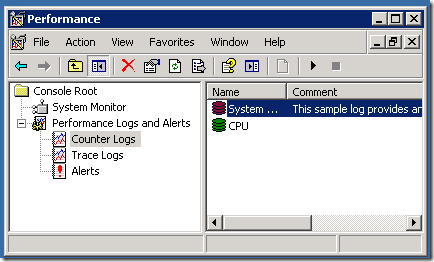
Select “Counter Logs” from “Performance Logs and Alerts” in the left panel
Right click in the right side panel and select “New Log Settings”
Give a name
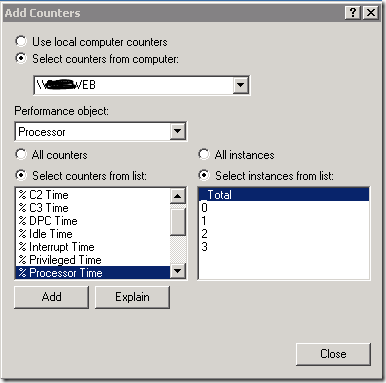
Click “Add Counters”
Add the object,
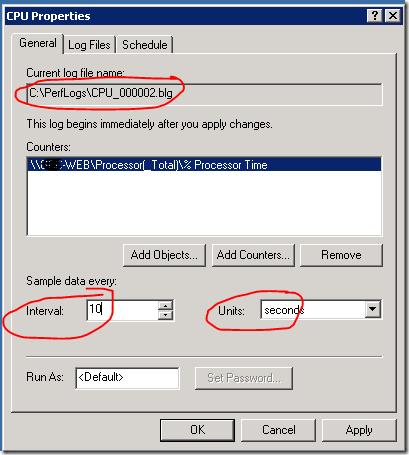
Set the log interval
If you want to run this as a different user you can specify that in this window
Now Apply setting
you can see the service started ( Green colour ) Right click and start it if it is not started
Now log application start logging performance data to the above file
here it is C:\PerfLogs\CPU_000002.blg
 Binbert Technology | Computer | Security | Networking | Mobile


